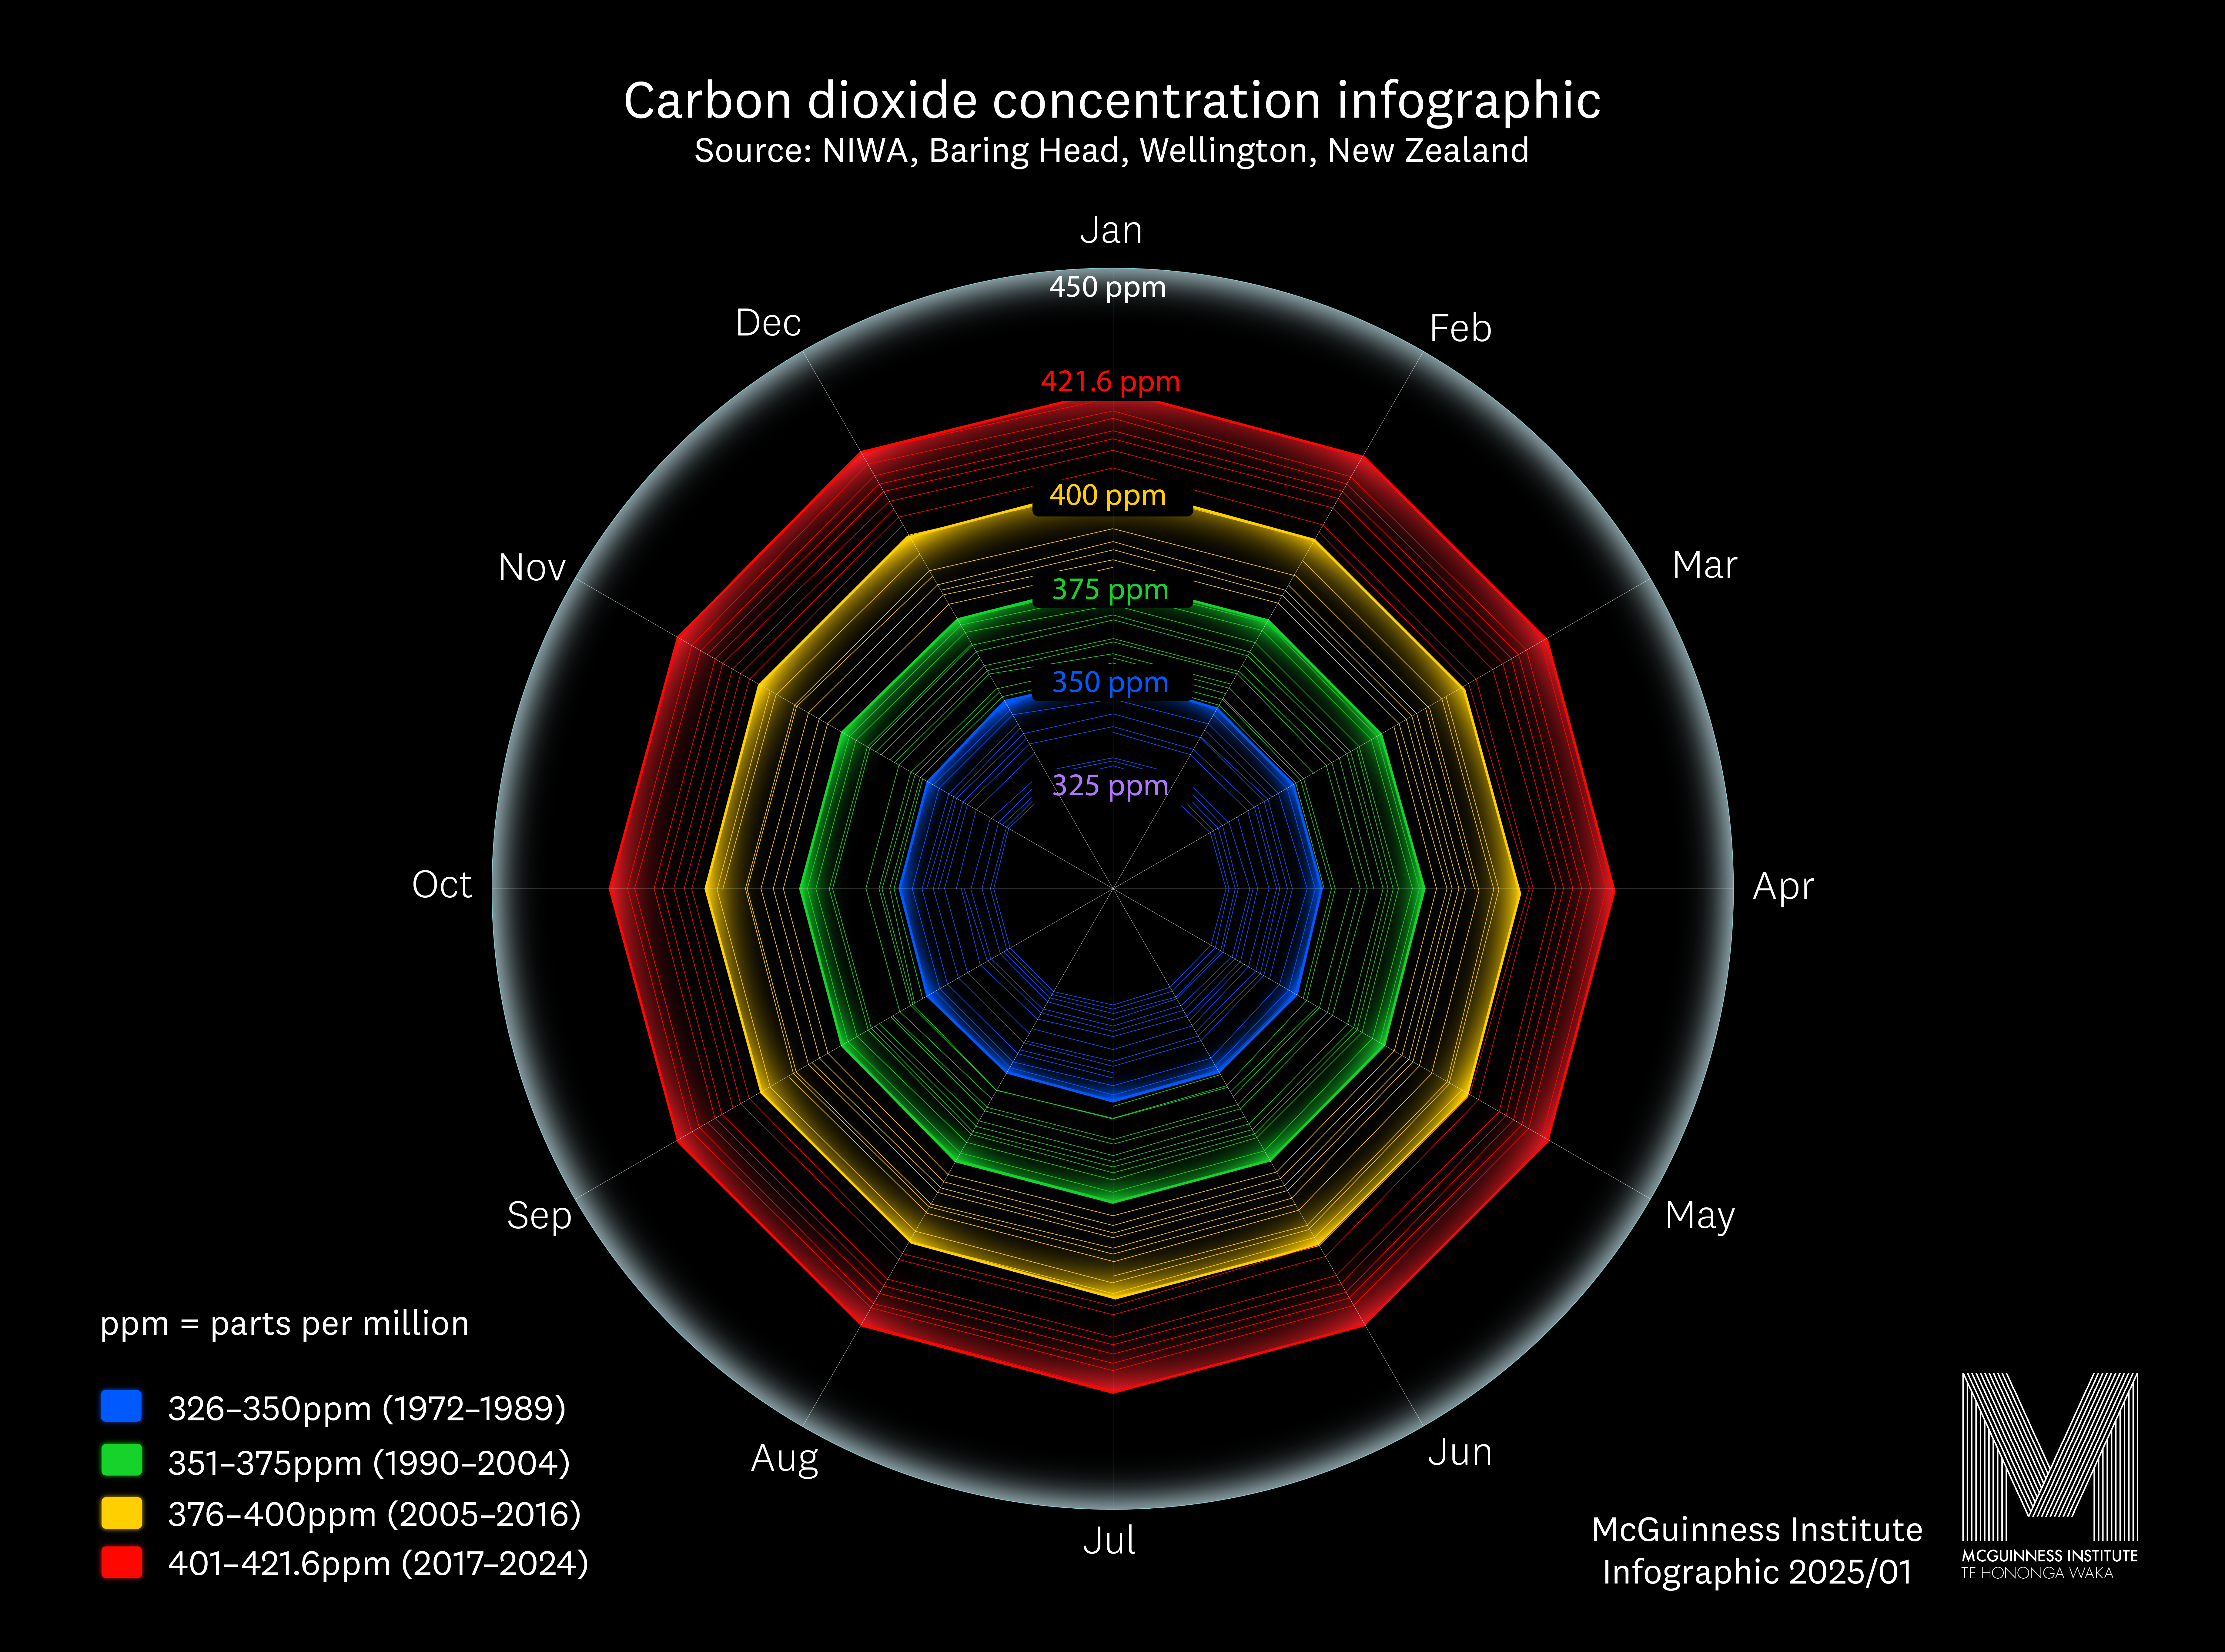
Carbon dioxide concentration infographic, 1972–2024
About the data
- This data uses the World Meteorological Organisation (WMO) X2019 scale. Note the Institute’s previous graph (2021) used the WMO X2007 scale, so some data points have changed by a small amount.
- The data used is the monthly average steady interval (baseline) CO2 parts per million (ppm) between 1972 and 2024 (provisional).
- Baseline data is collected in southerly wind conditions, so occasionally months have no baseline data; this is shown as gaps in the lines of the graph.
- For comparison, the pre-industrial level of CO2 in the atmosphere was 280ppm.
For more information on this data, refer to endnote [1]. The Institute is very grateful for NIWA for collecting and sharing this data.
Why is this infographic so important?
This infographic – from the Institute’s designers – shows changes in CO2 concentration collected from NIWA’s clean air station at Baring Head/Ōrua-pouanui since it opened (52 years ago). This station has been operating since 1972 and has the longest-running continuous CO2 measurements in the Southern Hemisphere.[2]
We think this is a must-watch measure for anyone wishing to understand the momentum driving change in New Zealand’s climate. NIWA describes this station, on the Wellington coast overlooking Cook Strait, as being internationally recognized for contributing ‘…to global scientific studies into climate change and our impact on the earth’s atmosphere. The air arriving at this site in a southerly condition has originated from areas of no human activity and therefore is not influenced by any local activity.’[3]
This data is not only nationally important – it is globally significant when compared with data from around the world.
Mauna Loa Observatory in Hawaii has collected CO2 concentration data for longer than anywhere in the world.[4] Between 2023 and 2024, it reported that atmospheric CO2 rose by 3.58ppm to 427ppm. This is Mauna Loa’s highest annual increase in atmospheric CO2 since it began recording (67 years ago). Scientists say this significant increase is likely due to both wildfires and the continued burning of fossil fuels.[5]
NASA reports that ‘Since the onset of industrial times in the 18th century, human activities have raised atmospheric CO2 by 50% – meaning the amount of CO2 is now 150% of its value in 1750. This human-induced rise is greater than the natural increase observed at the end of the last ice age 20,000 years ago.’[6]
Tragic wildfires are telling important stories about carbon and our climate: Data shows they are worsening, and this not only results from climate change, but contributes to it.[7], [8], [9]
For this reason, the Institute is scoping a paper on how New Zealand might measure and report carbon emissions from wildfires. If it were possible, it would act as a further incentive for governments to invest in wildfire management.
There are several opportunities. For example, MFE and Fire and Emergency New Zealand, in collaboration with others, could prepare a supporting paper on carbon emissions from New Zealand wildfires at the 2025 UN Climate Change Conference (UNFCCC COP 30) in November 2025 in Belém, Brazil. This might entice other countries to report their wildfire emissions, and as a result, ensure wildfires are seen as a global risk that needs a united global response.
As well as the wildfire paper mentioned above, the Institute is working on a number of other projects which relate to our changing climate as part of the ClimateChangeNZ project. ClimateChangeNZ seeks to explore a climate strategy for New Zealand. In 2025, the Institute is going to undertake additional climate work, including:
- Discussion Paper 2025/01 – Why we need to treat a crisis differently to an emergency
- Working Paper 2025/04 – List of Climate-related Cabinet Papers dated between 2001–2024 [WIP]
- Discussion Paper 2025/02 – How might New Zealand progress the Paris Agreement Crediting Mechanism (PACM)
- Discussion Paper 2025/03 – Hot Stuff: Managing and reporting on wildfires [WIP]
- Working Paper 2025/05 – Illustrating what 1 megatonne of carbon looks like in a New Zealand context [WIP]
- Working Paper 2025/08 – Mapping climate-related public policy instruments [WIP]
- Project 2058: Report 18 – Climate Change Strategy for New Zealand [WIP]
The Institute first shared an earlier version of this CO2 infographic using NIWA data in 2021. The Institute’s full 2025 work programme is available on our website.
Endnotes
[1] Stephens, B.B., Brailsford, G.W., Gomez, A.J., Riedel, K., Mikaloff Fletcher, S.E., Nichol, S. and Manning, M. (2013). Analysis of a 39-year continuous atmospheric CO2 record from Baring Head, New Zealand. Biogeosciences, [online] 10(4), pp.2683–2697. Available at: www.biogeosciences.net/10/2683/2013/ [Accessed 24 Jan. 2025].
[2] NIWA (n.d.). Daily CO2 measurements from NIWA’s atmospheric monitoring station at Baring Head | NIWA. [online] NIWA. Available at: https://niwa.co.nz/atmosphere/carbonwatch-nz/daily-co2-measurements-niwas-atmospheric-monitoring-station-baring-head [Accessed 27 Jan. 2025].
[3] NIWA (2023). Baring Head Atmospheric Research Station. [online] NIWA. Available at: https://niwa.co.nz/atmosphere/baring-head-atmospheric-research-station [Accessed 27 Jan. 2025].
[4] Ballance, A. (2020). Carbon Watch & 50 years of CO2 measurements in NZ. [online] RNZ. Available at: https://www.rnz.co.nz/national/programmes/ourchangingworld/audio/2018768161/carbon-watch-and-50-years-of-co2-measurements-in-nz [Accessed 27 Jan. 2025].
[5] Hashemi, S. (2025). Hawaiian Observatory Clocks Highest Annual Jump in Atmospheric Carbon Dioxide Since Its Records Began 67 Years Ago. [online] Smithsonian Magazine. Available at: https://www.smithsonianmag.com/smart-news/hawaiian-observatory-clocks-highest-annual-jump-in-atmospheric-carbon-dioxide-since-its-records-began-67-years-ago-180985868/ [Accessed 27 Jan. 2025].
[6] NASA (2024). Carbon Dioxide Concentration | NASA Global Climate Change. [online] Climate Change: Vital Signs of the Planet. Available at: https://climate.nasa.gov/vital-signs/carbon-dioxide/?intent=121 [Accessed 27 Jan. 2025].
[7] Fire and Emergency New Zealand (2023). Climate and Wildfire Risk Evidence Brief #205 – 2023. [online] Fire and Emergency New Zealand. Available at: https://www.fireandemergency.nz/assets/Documents/Research-and-reports/Report-205-Climate-and-Wildfire-Risk-Evidence-Brief-2023.pdf [Accessed 30 Jan. 2025].
[8] Penman, T. (2025). From LA to Australia: Preparing for the New Era of Wildfires – Australian Institute of International Affairs. [online] Internationalaffairs.org.au. Available at: https://www.internationalaffairs.org.au/australianoutlook/from-la-to-australia-preparing-for-the-new-era-of-wildfires/ [Accessed 29 Jan. 2025].
[9] Fire and Emergency New Zealand (2023). Understanding wildfire carbon emissions and lessons for the fire and emergency agency. [online] Fire and Emergency New Zealand. Available at: https://www.fireandemergency.nz/assets/Documents/Research-and-reports/Report-213-Understanding-wildfire-carbon-emissions-and-lessons-for-the-fire-and-emergency-agency_July-2023-v3.pdf [Accessed 30 Jan. 2025].


